
Social
Strategy, Content and CommunityPaid
Performance Paid Social & SearchCreative
Social Creative, Production & DesignInfluencer
Campaigns and UGC CreatorsTikTok Shop
Creator Affiliates, Content & more
Other Services
- Social Strategy
- Analytics & Insights
- Social Listening
- Campaigns

20 Essential Social Media Statistics You Need to Know in 2026
1,960,000,000 results when looking for Social Media Agencies in New York.

Contents
As a social media marketer, statistics are your best friend.
You conduct deep dives into your analytics to find the best-performing content, allowing you to publish more of what resonates with your audience. You also rely on statistics to learn about the audience demographics of each social media platform to determine where to invest your time and energy.
Essentially, this data plays a major role in shaping how you’re showing up online and connecting with your target audience.
Because the social media world is always changing and at a rapid pace, you can’t rely on last year’s statistics to influence this year’s social media strategy.
To get you up to speed, we have compiled a list of the social media statistics you need to know in 2026. This data will ensure you set yourself up for success by choosing the right platforms and creating the best content possible.
Social Media Platform Statistics
First, let’s dive into the number of active users each social media platform currently has.
This information allows us to determine which platforms are most popular at the moment and which ones have been gaining traction year to year.
Now, as a marketer, you may be wondering what to do with this information. Well, it can be used to help you decide which platforms will make up your social media strategy in 2026.
To ensure you’re getting the best results from your online presence, it’s wise to be on the platforms your audience is using regularly.
Plus, it helps to know which platforms are increasing in popularity because it provides insights into where you should consider investing more time.
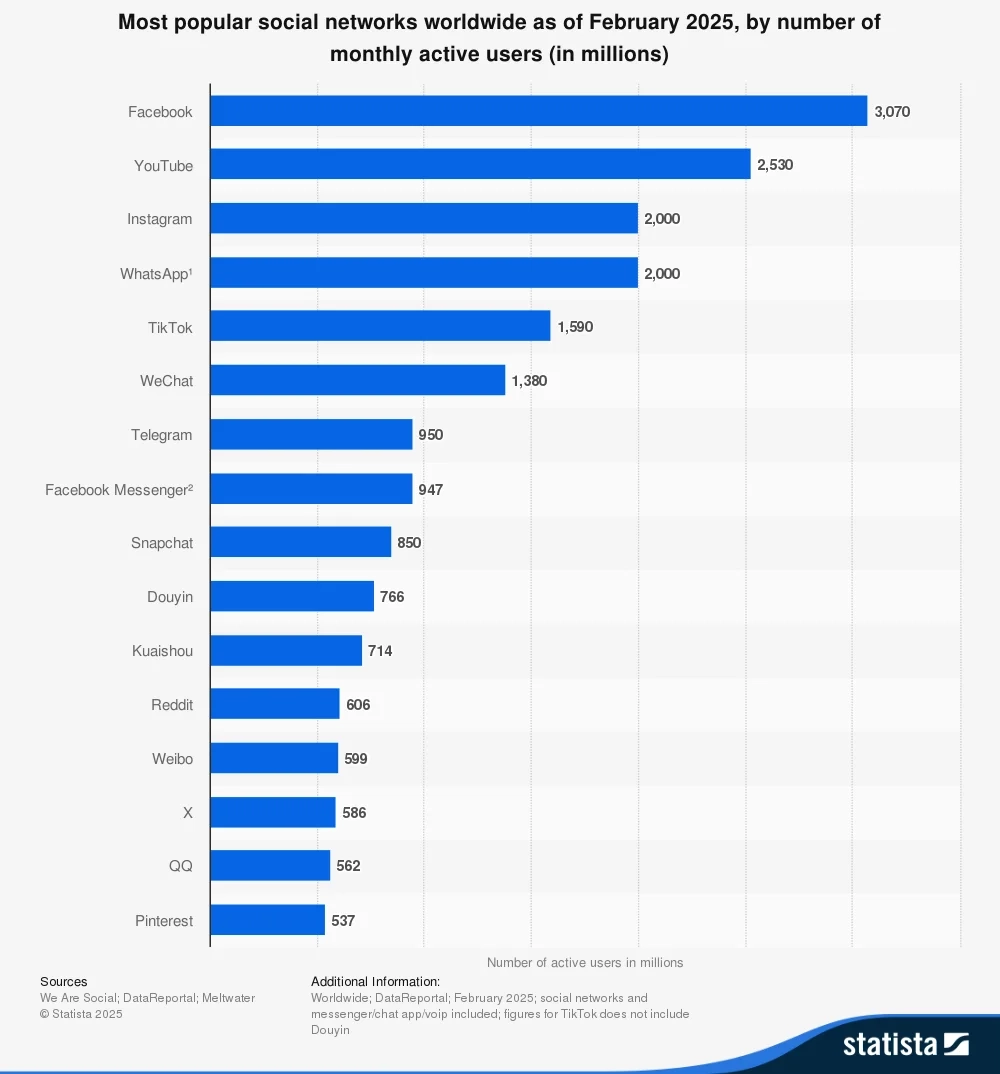
Below, you’ll find usage statistics for the top social media platforms. This data was gathered in February 2025 by Statista. Each platform is ranked based on the number of active users it has.
Facebook: 3.070 million active users
YouTube: 2.530 million active users
Instagram: 2.000 million active users
TikTok: 1.590 million active users
Snapchat: 850 million active users
X/ Twitter: 586 million active users
Pinterest: 537 million active users
As you can see from this list, Facebook is the social media platform that continues to reign supreme.
However, TikTok (which was launched in 2016) is beating out veterans like Snapchat, Twitter and Pinterest. That’s a good sign for the longevity of the platform itself. Using this information, consider if there’s a new platform that might be worth your attention this year.
Social Media Demographics Statistics
Demographics help us to understand the users on each social media platform. What gender do they identify with? How old are they? And where are they located?
Since you’ve probably created a unique buyer persona for your brand, you can use this data to make an informed decision about which platforms are right for us to use as marketers.
Here are some social media demographics statistics to consider for some of the top platforms today:
Males Represent the Largest Demographics on Facebook, Instagram, and Twitter
On Facebook, males between the ages of 25-34 represent the largest demographic on the platform. That age group comes in second place on Instagram, with males ages 18-24 ranking in the top spot in terms of usage. On Twitter, 39.1% of their users identify as female, meaning it leans predominantly male.
67% of TikTok Users in the United States are 18-19 Years Old
While a chunk of TikTok’s users in the States are 18-19 years old, only 41% of the platform’s users are over 50. TikTok has quickly become an online favourite for the Gen Z crowd. However, more age groups are joining and sharing content, primarily due to its popularity explosion during the COVID-19 pandemic that began in early 2020.
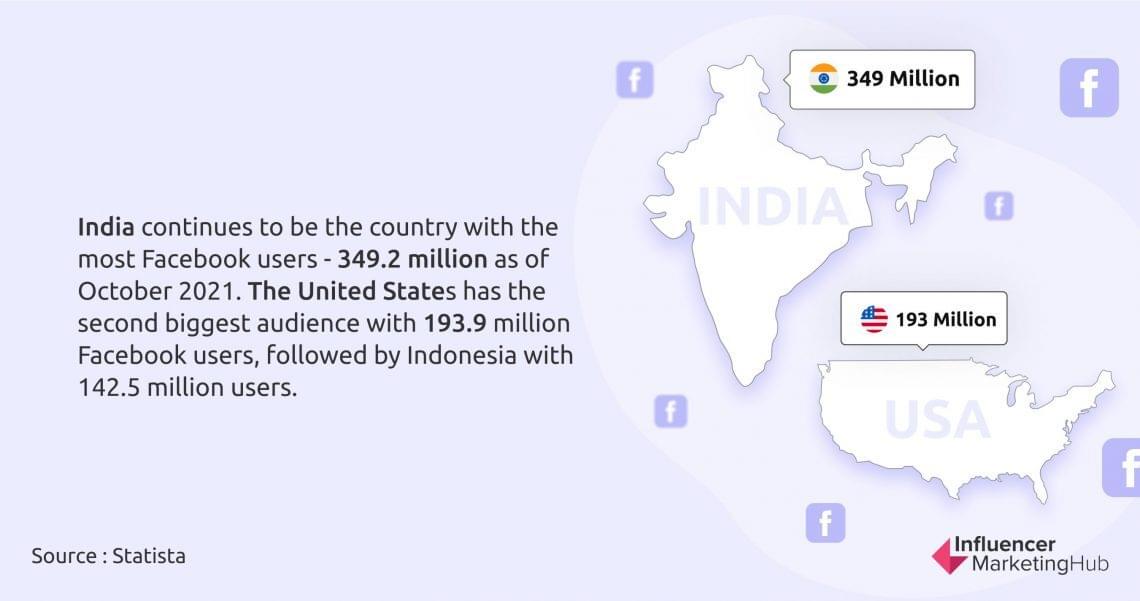
India is the Country With the Most Facebook Users
India has 378.05 million Facebook users, making it the top country for the platform. Trailing behind is the United States, which has 193.8 million Facebook users. Which countries come in right behind those two for Facebook popularity? Indonesia, Brazil, Mexico, the Philippines, and Vietnam.
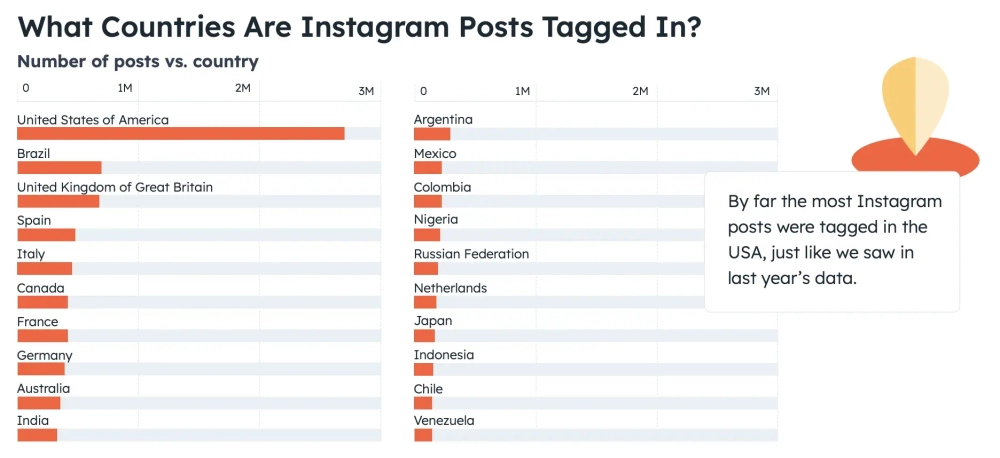
The Most Instagram Posts Come From the United States
The top three remain consistent with last year: the United States, Brazil, and the United Kingdom. Given the vast populations of the United States and Brazil, it's no surprise they hold top positions. Knowing this, it's no wonder that brands might want to capitalise on these audiences and plan their social media strategies accordingly.
Additionally, the English-speaking UK naturally claims a high spot. Spain, making a significant leap from 10th place, now secures the 4th spot, pushing India down the list.
The United States and Japan Are Twitter’s Top Two Countries
With 106.23 million users, the United States has the most Twitter users of any country worldwide. Japan is following right behind with 69.28 million users. In third place, we have India with 25.45 million Twitter users.
Pinterest is Most Popular in the United States
Pinterest is another social media platform where a majority of its active users reside in the United States, 96 million to be exact. Rounding out the top five are Germany, France, Canada and the Netherlands.
Social Media Usage Statistics
The world of social media is always evolving, including how marketers and users access and create content for each of the platforms. To gain a better understanding of how the world is using social media in 2023, here are some social media statistics centered around usage to shape your strategy:
62.6% of the World’s Population Uses Social Media
With more than half (62.6%) of the population worldwide using social media, it’s become a powerful tool for making new connections. Plus, more than two-thirds of the world’s population now has access to mobile phones, meaning social media is readily available at our fingertips every moment of the day.
The Amount of Social Media Users Is On the Rise
Engaging on social media stands out as a top online activity. In 2023, 4.89 billion people worldwide were actively part of the social media scene. Fast forward to 2027, and we're looking at an anticipated surge to nearly 6.05 billion users.
The Average User Spends 2 Hours and 24 Minutes on Social Media Daily
This data should come as no surprise with most of us accessing social media throughout the day on our smartphones. With those 2 hours and 24 minutes, users are scrolling through feeds, watching Stories, and spending time engaging with the accounts they follow.
The latest country-specific stats reveal that urban consumers in Kenya take the lead spending a substantial 3 hours and 56 minutes per day on social platforms. Brazil follows in second place with 3 hours and 38 minutes.

91% of Social Media Users Use a Mobile Connection to Access Platforms
Even though the top social media platforms offer desktop versions for access via computer, 91% of social media users opt to do their social media scrolling through a mobile device. Considering we typically carry phones with us all day, every day, it’s no wonder it’s the more popular option.
Social Media Marketing Statistics
Because many of us rely on social media as a marketing tool to generate brand awareness and grow businesses, it’s smart to consider the most effective ways to use and create content for each platform. Here are some statistics you should know for your 2024 social media strategy:
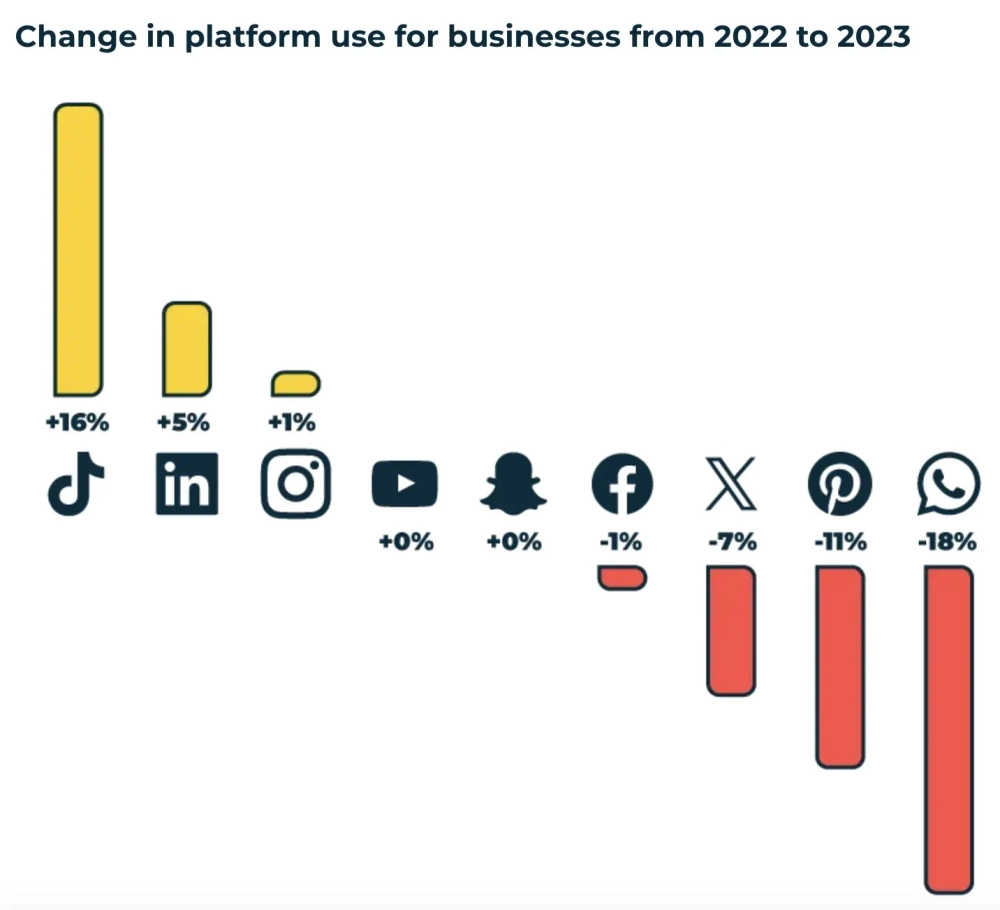
Businesses are Placing More Emphasis on TikTok, LinkedIn, and Instagram
Come 2026, savvy organisations will resist the pressure to be everywhere at once. Instead, they'll strategically unleash their top-performing channels driven by ROI. The focus will be sharp and selective, with a bold move to potentially abandon one or two platforms altogether if confidence and courage prevail. This is why working with a TikTok agency might be exactly what your brand needs to increase awareness and generate revenue on social.
500 Million People Use Instagram Stories Daily
With multiple social media platforms incorporating a “Stories” feature to share photos and videos throughout your day, many users might question which one to focus their attention on. However, it’s clear that Instagram Stories reigns supreme, with 500 million people using it daily. Facebook, on the other hand, has about 300 million people using Facebook Stories every day.
53.7% of Marketers Plan to Leverage Instagram Reels This Year
Modelled after the success of TikTok’s short and sweet videos, Instagram Reels is one of the many ways to create content on the platform. 53.7% of marketers have said they want to utilise Reels for their brand as it’s proven to be an effective way to gain more exposure.
But, did you know that not all creative performs on social? This is why working with an experienced social-first creative agency might be key to take your brand to the next level.
62.4% of Users Use Instagram to Find Products and Services
Harnessing social media as a potent tool for consumer research is the norm, with a significant 82.5% of social media users relying on these platforms to gather information about brands and products. In this research phase of the consumer cycle, over 60% favour the exploration journey on Instagram.
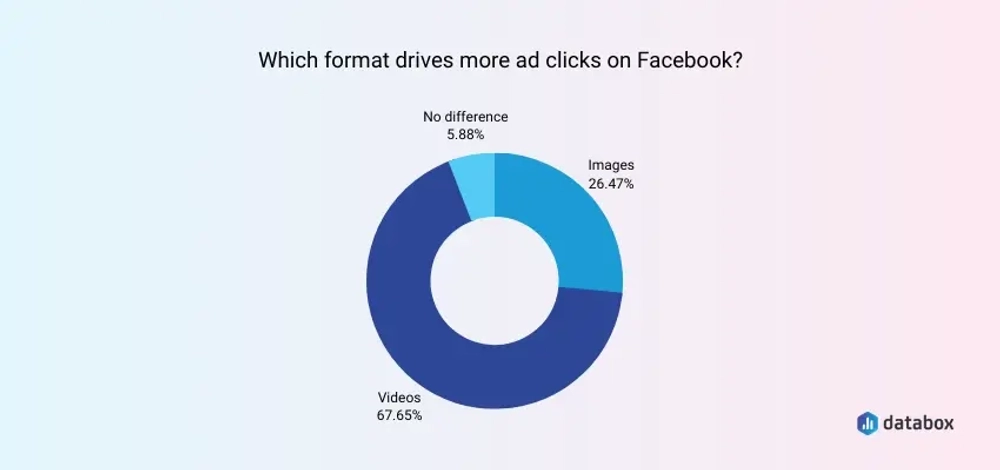
Video Ads Are the Way to Go on Facebook
If you’re planning to invest in advertising in 2022, social media statistics can help you create powerful advertisements that generate massive conversions. And when it comes to Facebook, video ads seem to perform better than other ad types, making them worth the extra time and money they require.
Engagement is Highest for Facebook Pages With Fewer Than 10,000 Fans
It’s no secret that the Facebook algorithm has made it more challenging to get content noticed over the years. Although, it may seem surprising to note that pages with fewer than 10,000 fans received the highest engagement rate on their posts (0.45%).
Tweets With One or Two Hashtags Receive 21% More Engagement
Studies indicate that tweets adorned with one to two hashtags can boost engagement by a notable 21%. However, the magic seems to fade when tweets sport more than two hashtags, potentially leading to a 17% dip in engagement. Hashtag strategy matters in the world of tweets and engagement!
Twitter Will End 2023 With About $2.5 Million in Ad Revenue
Elon Musk's X (formerly Twitter) finds itself in the midst of a considerable slump in advertising revenue. Inside sources disclose that X anticipates concluding 2023 with approximately $2.5 billion in ad revenue, marking a significant decline from previous years and falling half a billion short of its targeted $3 billion. The ad revenue landscape for X is navigating challenging terrain.
The Top Reason for Using Social Media is to Keep in Touch with Friends and Family
Other top reasons for being on social media include filling spare time and reading news stories. Instead of turning on the TV to get the latest news, people are more inclined to visit social media to get the scoop on what’s happening in the world. 34.2% of people have made social media a go-to for news.

Using Social Media Statistics to Shape Your Strategy in 2026
Overall, these social media statistics can play a major role in helping you to plan your strategy for the year ahead. (Don’t think it’s too late if you haven’t started yet!)
Use this information to help you determine which platforms are worth your time, energy, and money in 2026 based on active users and demographics.
Allow usage data and marketing statistics to shape how you’re using these platforms as a marketer and the kind of content you’re sharing. When you use social media with purpose, you stand a much better chance at reaching your brand goals with ease.


