
Social
Strategy, Content and CommunityPaid
Performance Paid Social & SearchCreative
Social Creative, Production & DesignInfluencer
Campaigns and UGC CreatorsTikTok Shop
Creator Affiliates, Content & more
Other Services
- Social Strategy
- Analytics & Insights
- Social Listening
- Campaigns

21 Essential Twitter (X) Statistics You Need to Know in 2026

Contents
Initially launched in 2006, Twitter started as a micro-blogging platform allowing users to share short, 140-character posts (also known as “tweets”).
Its popularity increased a year later when Twitter usage jumped from 20,000 tweets per day to 60,000 during the South by Southwest conference. Since then, it’s become a go-to place for users to share daily updates, talk about their interests, and connect with others worldwide.
While Twitter has since given users the ability to use 280 characters in a single tweet, it still thrives on short and succinct messaging. And it’s become a valuable tool for marketers looking to expand their online presence.
In this post, we’ve compiled some Twitter statistics regarding its usage, demographics, and more to better understand the state of Twitter and whether or not it’s a worthwhile platform to invest in.
Top Twitter Statistics
To kick things off, here are a few top Twitter statistics that every marketer should know about the platform and its popularity.
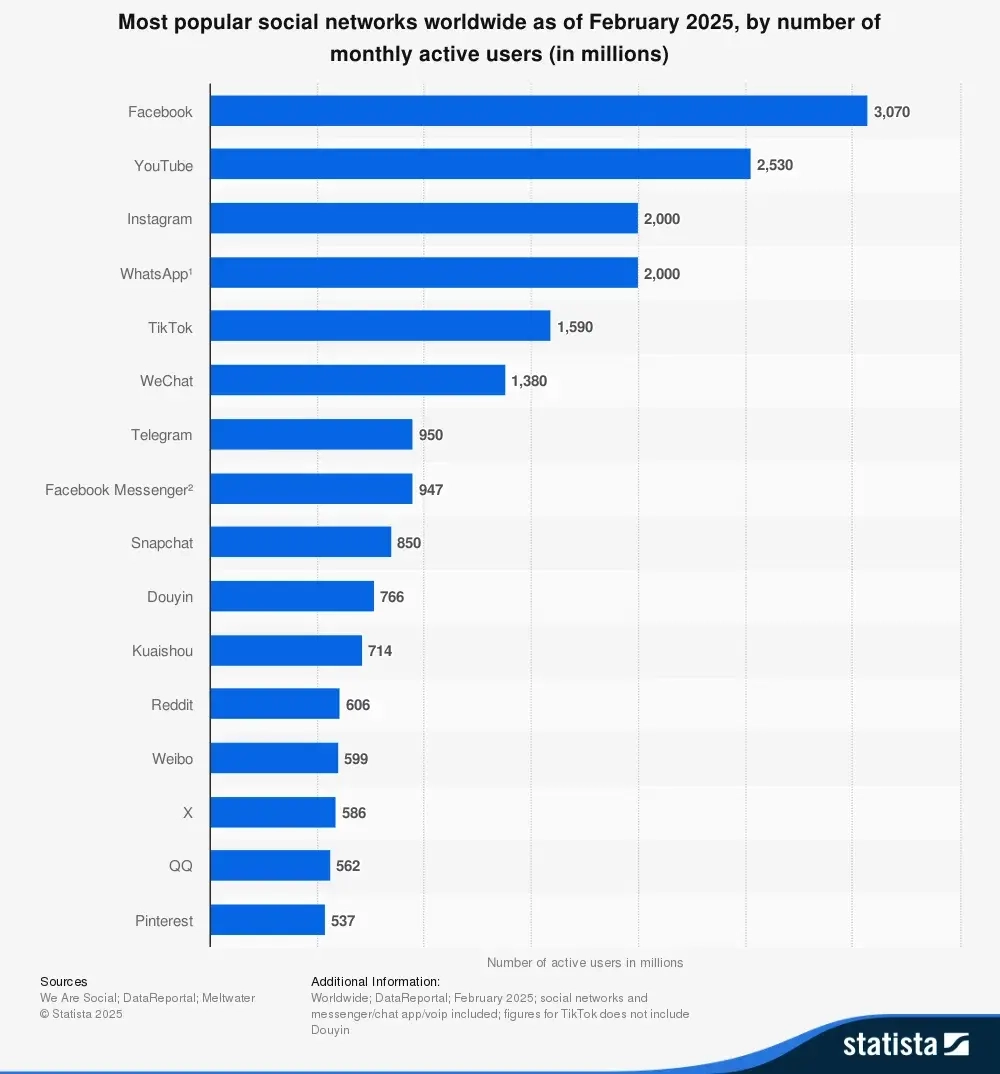
Twitter Ranks as the 14th Most Popular Social Network
Ranking in 14th place in terms of the number of users. Twitter has fallen from position number 12 in 2024, with platforms like Reddit and Weibo getting ahead.
10% of Twitter Users Are Responsible for 92% of Tweets
As it turns out, most Twitter users aren’t super active when it comes to actually sharing content. In fact, it seems most users only tweet once per month on average. That means most people are visiting Twitter to consume rather than create. Data shows that 10% of Twitter users are responsible for 92% of the tweets from all U.S. users, meaning there’s a particularly active group of users publishing a large chunk of content.
48% of Users Turn to Twitter to Get the Latest News
We turn to social media for a number of reasons. But how do people primarily use Twitter? In the U.S., it turns out the main reason for using Twitter is to get news. Here’s a full breakdown of how people are using Twitter:
- 48% to get news
- 48% to get entertainment
- 34% to keep in contact with friends and family
- 33% to follow brands/companies
- 14% to strengthen their professional network
- 12% for other purposes
Twitter’s Penetration Rate in the UK Dropped to 10.49% from 45% in 2020
While the penetration rate has dropped to 10.49% in the UK as of July 2024, it doesn’t seem that Twitter is going anywhere anytime soon. It’s still a popular choice for making connections online.
Elon Musk Bought Twitter for $44 Billion
On October 28, 2022, Elon Musk bought Twitter after a tumultuous negotiation process. On May 13, 2023, he stepped down to Executive Chairman & Chief Technology Officer, and named Linda Yaccarino, former head of advertising at NBCUniversal, new Twitter CEO.
Twitter Usage Statistics
Next, let’s dive into some Twitter usage statistics. Even though Twitter has been around for quite some time, it continues to see growth in its user base. Not only that but there are tons of tweets being posted on a daily basis, ensuring there’s always something interesting being shared.
Twitter Has 561 Million Users Globally
When looking at its audience worldwide, data shows that Twitter has 561 Million users so far in 2025. Although it may fall behind platforms like Facebook and Instagram, which have users in the billions, Twitter still has a loyal audience of those who log in on a regular basis.
In fact, Elon Musk recently announced that X/Twitter had about 259.4 million daily active users in 2024, but now down to 132 million daily active users in late 2025.
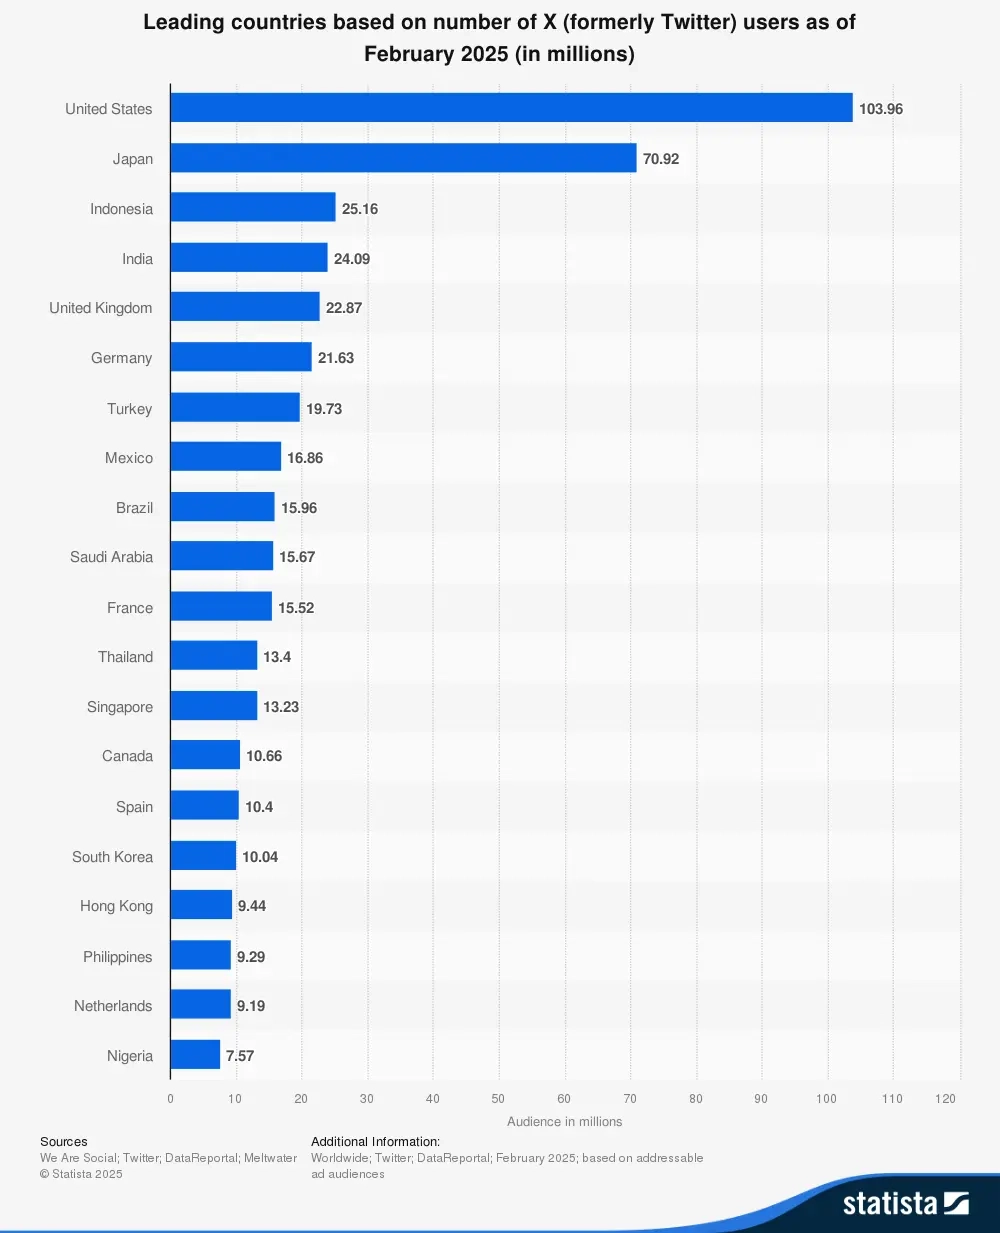
In the UK, Twitter Has 23.15 Million Users
If we’re just looking at the UK alone, 22.87 million people had Twitter accounts as of February 2025. More than half of those Twitter accounts are owned by males, meaning they mostly dominate the platform gender-wise.
Twitter Statistics in the US
By comparison, the U.S. has 103.96 million users as of February 2025.
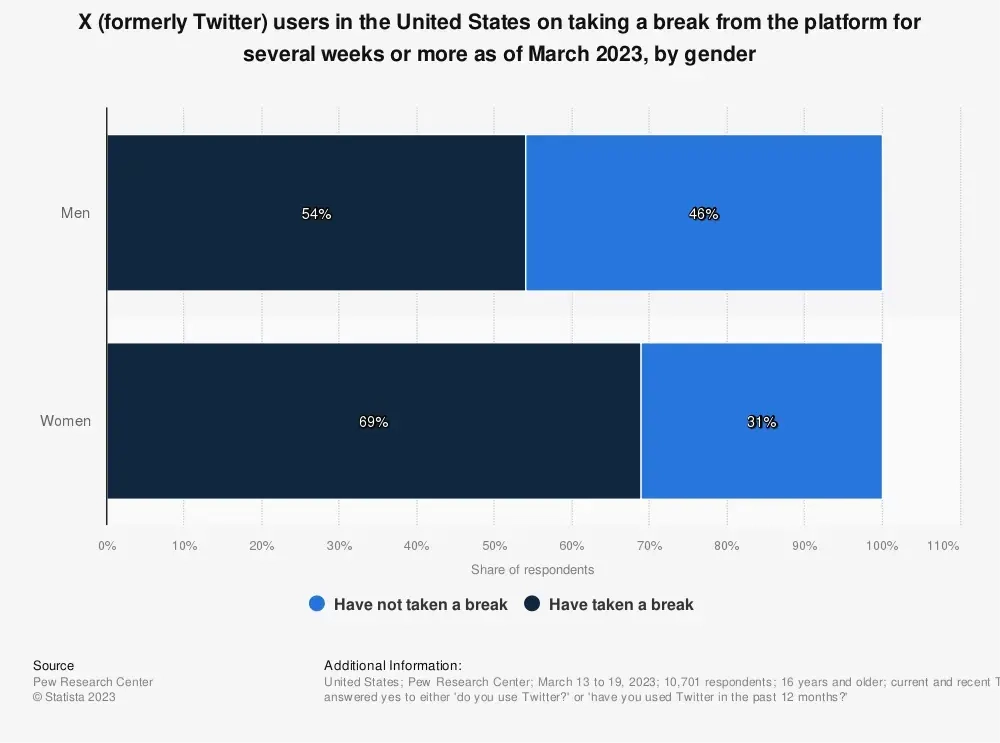
Interestingly, 69% of women in the U.S. have admitted to taking a break from Twitter, whereas only 54% of men have stepped away.
At Least 500 Million Tweets Are Sent Every Day
Twitter’s users certainly have a lot to share with their followers! The platform has become a place to share daily updates and discuss common interests with other users around the world. At least 500 million tweets are sent on a daily basis, meaning there are plenty of conversations to join.
Gen-Z Users Like Twitter
Twitter is gaining popularity 30% more quickly than Instagram within the Gen Z demographic. Brace yourselves: Gen Z actually likes Twitter.
Americans Spend an Average of 31 Minutes Per Day on Twitter
There’s no denying that we spend a lot of time on social media every day. It’s so easy to pick up our phones and begin mindlessly scrolling to see what friends, family, and our favourite brands are sharing.
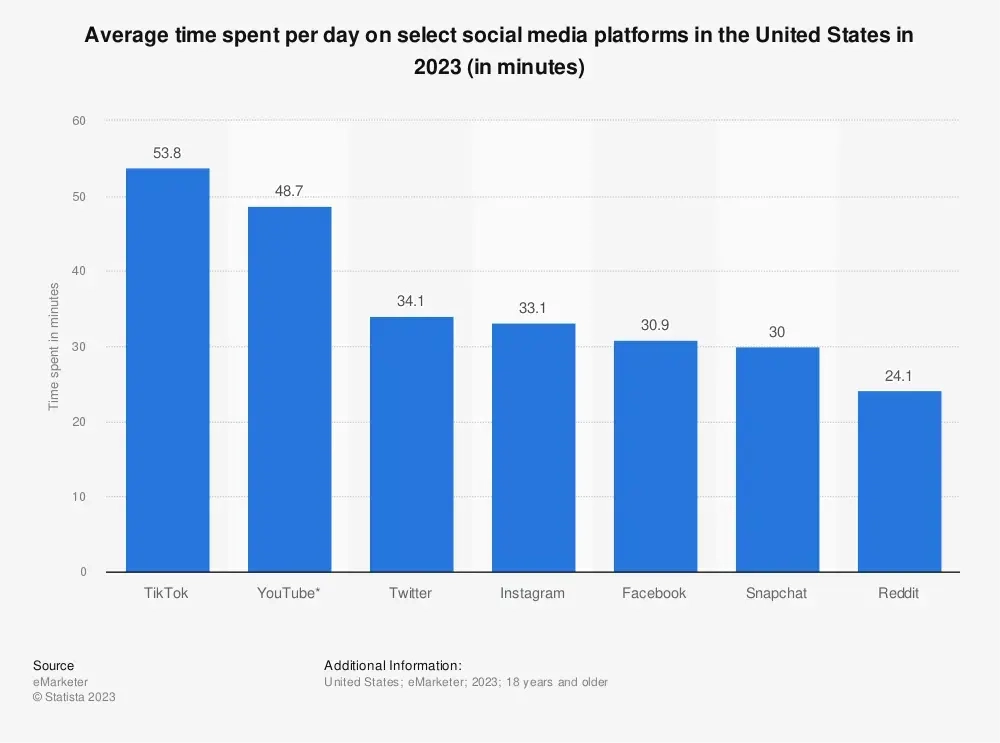
Following TikTok, where users spend an average of 31 minutes per day, Twitter comes in as the second-most popular social media platform in terms of daily time spent.
In the UK, it’s reported that adults only spent around four minutes on Twitter.
96% of Twitter Users in the U.S. Report Using the Platform Monthly
For many users in the U.S., Twitter isn’t a platform they turn to on a daily basis. 96% of users say they only check Twitter monthly. 84% say they use Twitter weekly, and just 52% say they use it daily.
However, the time spent on Twitter by Americans paints an interesting picture—they spend 34.1 minutes per day on the platform.
There Were 162k+ Downloads of the Twitter App on iOS in the UK
It appears there are slightly more iPhone fans among Twitter users in the UK. There have been over 162,000 downloads of the iOS version of the Twitter app and just 150,200 for the Android app.
Twitter User and Demographics Statistics
A few years ago, it seemed that Twitter’s growth was peaking. However, things changed after 2020 when a global pandemic struck, prompting more people to join the platform. With what appears to be a reignited interest in snappy 280-character tweets, many marketers are wondering if they should invest their time and energy into posting content there. Luckily, there’s Twitter statistics will let you know the demographics of its user base, helping you to determine if your target audience is active there.
The U.S. Has the Most Twitter Users
The country with the most Twitter users is the United States with a total of 103.96 million users. The other countries rounding out the top five are Japan, India, United Kingdom and Indonesia.
Twitter is Mostly Male-Dominated, Making Up 63.7% of Their User Base
For brands that have offerings targeted toward males, Twitter is the place to be. 63.7% of Twitter’s user base identifies as male, while only 36.3% are female. That’s a pretty big gap!
Twitter Platform Statistics
Next, let’s share some Twitter statistics that are tied directly to the platform itself so you have a better understanding of what’s going on behind the scenes.
Twitter’s Global Revenue was Nearly $4.73 Billion in 2022
Generating $4.73 billion in 2022 was certainly an accomplishment for Twitter. Their revenue has seen a steady increase each year. The only exception was when it dipped slightly from 2016 to 2017. Other than that, the platform has been consistent in bringing in revenue.
The Platform Recently Generated More Than $4.5 Million in Advertising Revenue
A chunk of Twitter’s revenue comes from the advertising dollars brands spend to market themselves on the platform. In 2021, they made more than $4.5 million in advertising revenue, which was a $1.3 million increase from the previous year.
In 2021, Twitter Spent $1.17 Billion Dollars on Sales and Marketing
Showing the importance of investing in your success, Twitter is no stranger to putting money into its sales and marketing. In 2021, they spent $1.17 billion dollars on marketing-related expenses.
Twitter Marketing Statistics
If you want to beat the algorithms and get your brand in front of more people, investing in ads is a smart way to go. It can help you generate awareness, engagement, and conversions. These Twitter statistics show just how effective their platform can be for anyone wanting to run ads there.
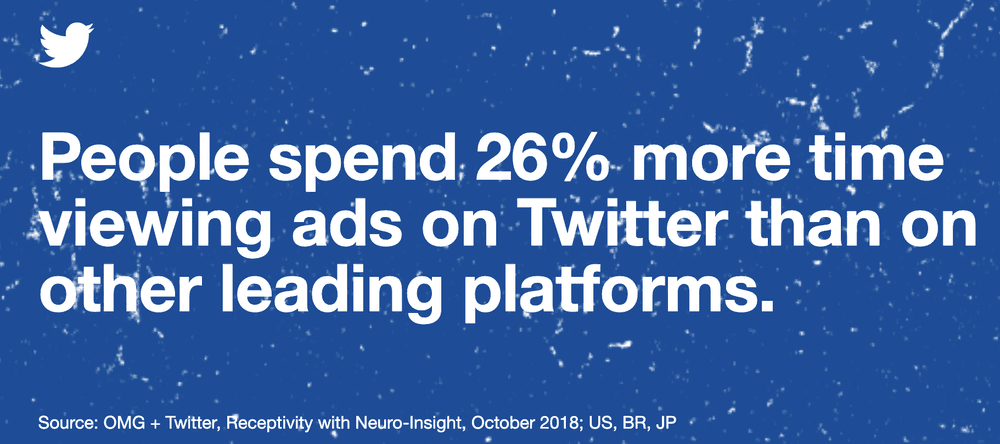
People Spend 26% Longer Viewing Ads on Twitter
Ads are on every social media platform these days, but a lot of times users just scroll on past. If you are planning to run video ads anywhere, you need to be able to grab and maintain your viewer’s attention. According to Twitter, people are spending 26% more time viewing ads on Twitter than on any other social media platform. With Twitter ads performing so well, it’s no wonder many brands choose to market their offering there.
Twitter Has Experienced a 35% Year-Over-Year Increase in Global Ad Engagement
Engagement is one of those marketing metrics that are important for brands to track. It shows that users are interested in what you’re sharing, while also communicating to algorithms that your content is relevant to others. Twitter has seen a 35% year-over-year increase in global ad engagement, making it even more enticing for brands to develop Twitter ads.
Brands That Spend More on Twitter Are Seen as More Culturally Relevant
Twitter’s advertising platform may also be a way for brands to boost their relevancy. Twitter’s Agency Playbook states brands that spend more on ads are seen as more culturally relevant. Not only that, but those brands that are more culturally relevant report seeing more revenue.
Twitter for Business Statistics
And finally, for those curious how businesses fare on the micro-blogging platform, these Twitter statistics communicate the value the platform can add to their overall social media strategy. Twitter shows promise when it comes to assisting businesses in gaining both awareness and conversions.
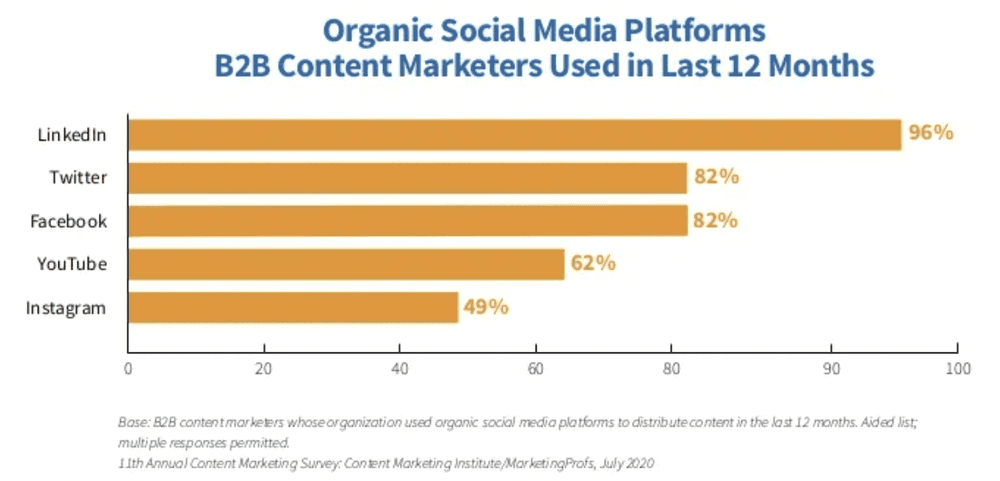
82% of B2B Content Marketers Use Twitter
Research from Content Marketing Institute shows that 82% of B2B (business to business) companies are using Twitter. Many businesses turn to the platform to share their latest content, promote offerings, and connect with their target audience. If you’re a business owner, there’s a good chance your competition is already there and nurturing those relationships.
79% of Twitter Users Follow Brands
Don’t fall into a trap of thinking that Twitter users are only there to follow family and friends. 79% of users follow brands to see their latest updates. The reality is, many brands provide informative and entertaining content and their fans love to support them by following and engaging.
It’s the Number One Platform for Brand Interaction
Given that Twitter makes it easy to connect with others in real-time, it should come as no surprise that it’s reportedly the top platform for brand interaction. Many companies are committed to responding to their online community with a short and sweet tweet. In fact, some even have dedicated Twitter accounts for handling customer support inquiries.
Using These Twitter Statistics
Our time is precious, meaning that, as marketers, we need to be smart about where we’re investing our energy. Use these Twitter statistics to determine if it’s a worthwhile platform for your brand to commit to in 2024.
They provide a great understanding of what’s happening on Twitter, what its users are like, and more so you can determine if it’s where your brand should be online.


