
Social
Strategy, Content and CommunityPaid
Performance Paid Social & SearchCreative
Social Creative, Production & DesignInfluencer
Campaigns and UGC CreatorsTikTok Shop
Creator Affiliates, Content & more
Other Services
- Social Strategy
- Analytics & Insights
- Social Listening
- Campaigns

21 Essential Meta Statistics You Need To Know in 2026

Contents
As a marketer, it’s important to have an understanding of the social media platforms you’re using.
Knowing the demographics behind each platform’s user base will help you decide where you should be investing your time and your marketing budget. Not only that, but also sometimes it’s just fascinating to learn more about the platforms we use daily, both personally and professionally.
In this article, we have rounded up some essential Meta statistics everyone needs to know in 2026. These statistics encompass Meta’s suite of products, with a focus on Facebook and Instagram.
Meta User Statistics
Curious about the demographics of those who are spending their time on Meta’s products like Facebook and Instagram? You aren’t alone! Luckily, there’s plenty of data that offers insights into its user base. These Meta statistics will give you a better sense of who is using these platforms.
1. Meta Has More Than 3.48 Billion Users Worldwide in 2025
In Q1 2025, Meta announced that they crossed the 3.48B monthly active users.
2. India Leads the Way in Terms of Audience Size for Facebook and Instagram
It’s safe to say that social media is pretty popular with those who reside in India. That’s because there are approximately 383.5 million Facebook users and 413.85 million Instagram users. The U.S. comes in second place for both platforms when looking at audience reach. There are 196.9 million Facebook users in the U.S. and 171.7 million Instagram users.
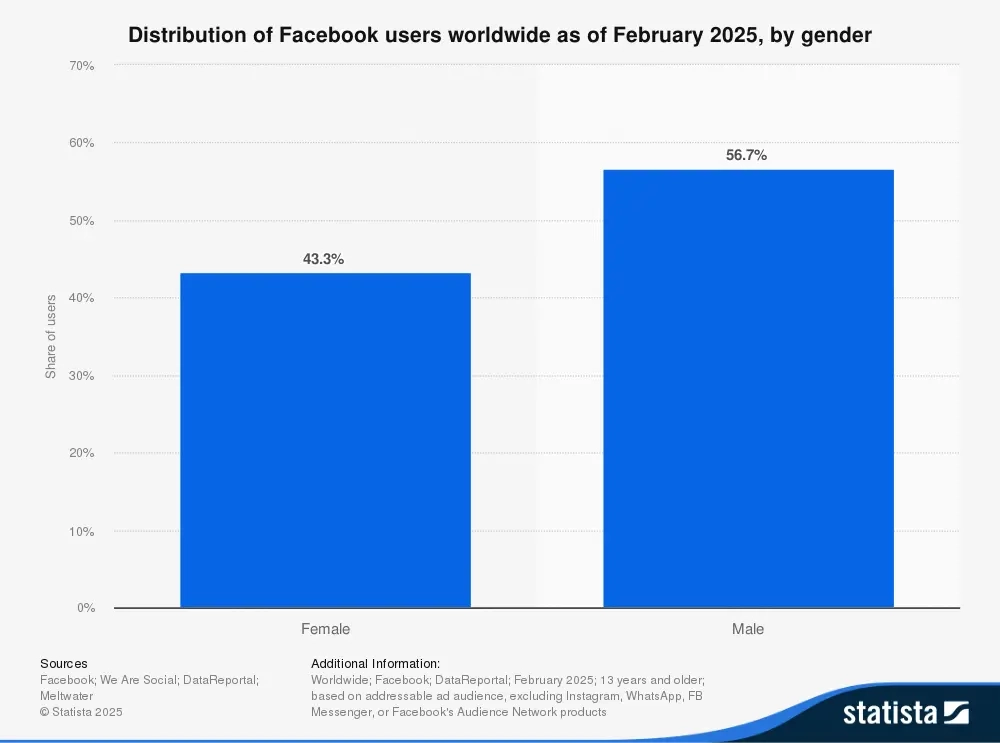
3. A Majority of Facebook’s Global User Base is Male
According to research from February 2025, 56.7% of Facebook’s global audience was male. Meanwhile, 43.3% were female. Although it’s not a huge gap, it does show that men are more active on the platform.
4. Instagram’s U.S. User Base Skews More Female
On the other hand, Instagram has a much smaller gender gap when it comes to its users. Females made up 55.4% of the platform’s user base, while males were 44.6%.
Meta Worldwide Statistics
Now, let’s switch gears and look at Meta’s impact on a global scale. These Meta statistics communicate just how popular the company’s suite of platforms is with people worldwide. This way, you can see how much reach they have and how much control they have over the social media world.
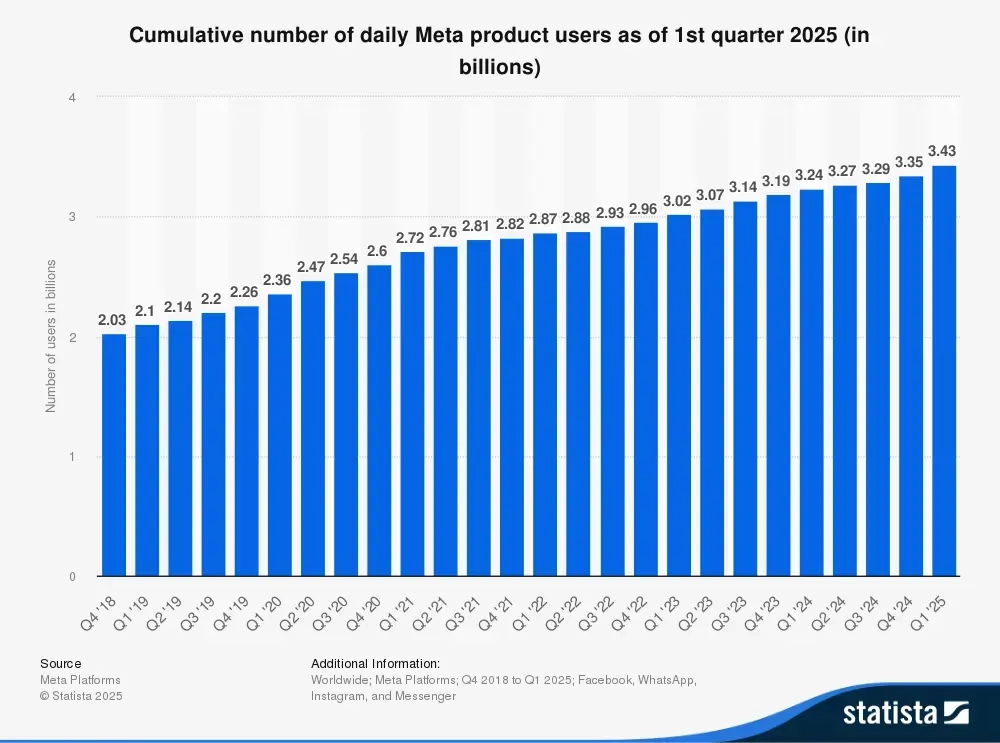
5. 3.43 Billion People Use at Least One of Meta’s Products Daily
It bodes well for a company when users turn to its platforms every single day. In Q1 of 2025, it was reported that 3.43 billion people used at least one of Meta’s core products daily. Those products include Facebook, WhatsApp, Instagram, and Facebook Messenger.
6. Meta’s Total Revenue Decreased to $116 Billion in 2022
In 2022, the company’s revenue was reported to be $116 billion. That’s a decrease from the previous fiscal year, in which Meta made $117 billion. This is the first time that revenue has declined for the social media company. However, it increased back again in 2023, making $134.9 billion.
Meta UK Statistics
It’s safe to say that Meta’s various platforms are popular all around the world, but do they stack up when looking at the United Kingdom’s population alone? Here are some Meta statistics just for those of us in the UK so you can gain an understanding of how the platforms are used here:
7. Meta’s Platforms Are Most Popular With UK Residents Aged 25-34 Years
Research from April 2025 has shown that Meta’s social media platforms (such as Facebook and Instagram) were most popular with UK residents aged 25-34 years. Women ages 25-34 years made up over 12.5% of Meta’s total UK user base. Men in the same age group accounted for 11.9% of users.
8. Usage of Facebook and Instagram Increased in Early 2022
Both Facebook and Instagram saw a slight surge in popularity among UK users in the first three months of 2022. When looking at just British consumers, Facebook reported a 6.6% increase in daily use. Meanwhile, Instagram saw a 6.7% increase in daily use.
9. In Terms of Reach, WhatsApp is the Most Popular Social Media Platform
Based on data from the third quarter of 2024, WhatsApp was reported to be the most active social media network in the UK. Nearly 79.9% of internet users said they also used WhatsApp. Facebook came in second place with 72.3% of internet users on the platform. Facebook Messenger and Instagram took the third and fourth spots, respectively.
Meta Platform Statistics
Now, let’s take a moment and look at some of Meta’s top platforms individually. This way, you can see just how popular they are in terms of active users. Here are some Meta statistics that will interest you:
10. Instagram Has 2 Billion Monthly Active Users
In 2025, Instagram has 2 billion monthly active users. Instagram is ranked as the 3rd most popular social network by number of users. In front is Facebook with 3.07 billion.
11. Facebook is the Most Used Social Network, with 3.07 Billion Monthly Active Users
When it comes to monthly usage, Facebook continues to reign supreme. Meta’s most popular platform boasted a whopping 3.07 billion monthly active users. It took over 14 years for them to reach this milestone, but the platform is sure to see even more growth in the years to come.
Meta Advertiser Statistics
There’s no denying that Facebook and Instagram are two of the top platforms companies consider when they want to invest in social media advertising. And it’s for good reason! Both provide incredible opportunities for a company to build brand awareness and drive sales. Here’s why:
12. There Are More Than 10+ Million Active Advertisers on Meta’s Platforms
Should you decide to start running ads on platforms like Facebook or Instagram, you’ll be in good company. Meta says they have more than 10+ million active advertisers using its platforms. It just goes to show that there’s room for everyone to jump on board with paid ads.
13. Facebook Ads Show a Steady 4.3% Increase in Reach
Meta’s own data shows that Facebook’s advertising reach enjoyed steady growth in the twelve months ending in January 2025. The total number of users that marketers could reach with Facebook ads increased by 93.3 million, a 4.3% increase in Facebook's global advertising reach.
14. Facebook Ads Reach 62.6% of all Americans aged 13+
Facebook provides insights into potential local advertising audiences, representing a percentage of the total population aged 13 and above:
Mexico: A substantial 87.0%
United Kingdom: Commanding 60.7%
France: At a noteworthy 56.1%
Italy: Holding strong at 53.2%
India: Encompassing 29.5%
These figures offer a snapshot of the advertising landscape on Facebook, showcasing the platform's reach and penetration into diverse local markets.
15. Users Post Over 1 Billion Facebook Stories Every Day
The Stories format maintains its upward trajectory in popularity, captivating users on Facebook, Instagram, and WhatsApp. A solid 62% of users express their intent to further engage with Instagram and Facebook Stories in the coming days.
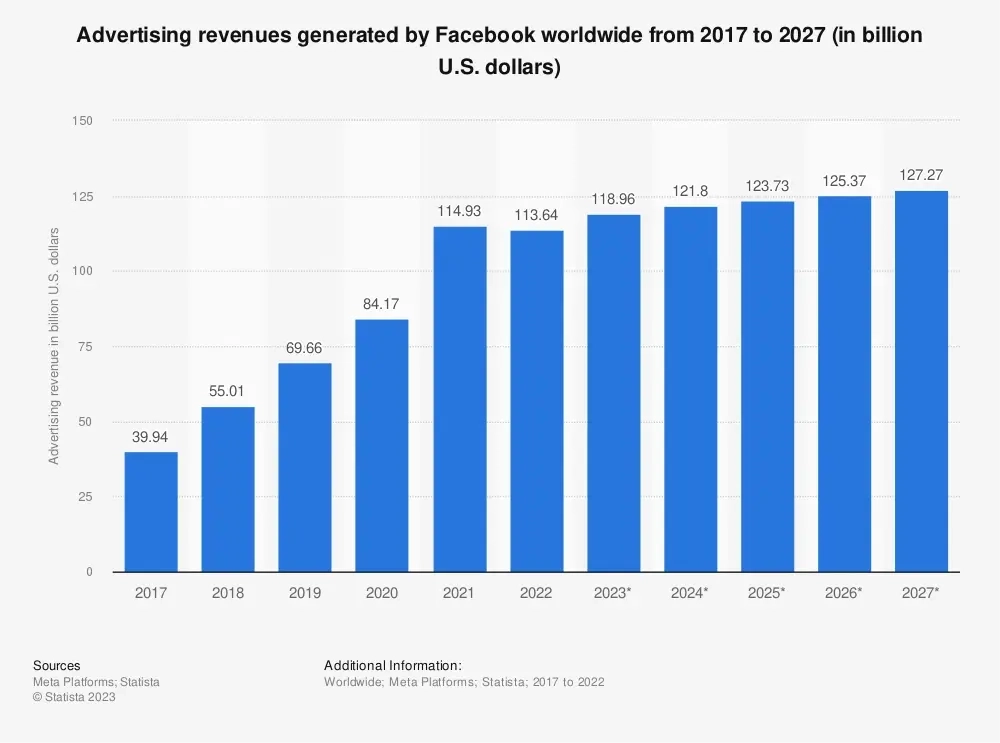
16. Facebook Global Ad Revenue Is Predicted to Top $127.27 Billion by 2027
It’s predicted that Facebook's global ad revenue in the U.S. will hit $127.27 billion in 2027.
Meta Stock Statistics
If you’re interested in the stock market, you might want to know who the biggest Meta shareholders are. Although you probably know who holds the top spot already! Here are some Meta stock statistics that show how much controlling interest different parties have:
17. Mark Zuckerberg Owns the Majority Shares of Meta Platforms Inc.
Facebook was founded by Mark Zuckerberg in February 2004, and he’s been the CEO ever since. So, it should come as no surprise that Zuckerberg has the controlling interest in the company, owning 958,000 shares of Class A and 346.05 million shares of Class B. These shares helped Zuckerberg reach a net worth of $175.4 billion. This makes Zuckerberg the top institutional investor in the company.
18. Vanguard Group Inc. And BlackRock Inc. Are Also Top Shareholders
Rounding out the top three institutional investors in Meta are the Vanguard Group Inc. and BlackRock Inc. Vanguard currently owns approximately 158.9 million shares of Meta, which is 7.16% of all outstanding shares. If you aren’t familiar, Vanguard is one of the world’s largest investment management companies.
Meanwhile, BlackRock Inc. has about 155.9 million shares of Meta. This represents 6.6% of the total outstanding shares in the company. BlackRock is one of the world’s leading investment firms.
19. Schroepfer, Fischer, and Wehner Are the Top Individual Insider Shareholders
When looking at individual insider shareholders, you’re looking at who holds shares of Meta through direct ownership. The individual who owns the most shares is Michael Schroepfer, who is currently Meta’s Chief Technology Officer. However, he stepped down from his role in March 2022. Schroepfer owns 630,612 Meta shares, representing 0.02% of the company’s total outstanding shares.
Next up is David Fischer, who is the Chief Revenue Officer of Meta. He owns a total of 37,089 Meta shares, which is 0.01% of the company’s total outstanding shares. And rounding out the top three is David Wehner. Wehner has been the Chief Financial Officer at Meta since 2014. He owns 26,948 shares of Meta.
Meta Acquisition Statistics
In the tech world, it’s not uncommon for one company to acquire another, which is exactly what Mark Zuckerberg has been doing over the years. What started as only Facebook has become an entire brand that houses multiple platforms he’s been able to acquire. Here are some Meta statistics about two of its most well-known acquisitions:
20. Instagram Was Acquired for $1 Billion in Cash and Stock
Launched in 2010 by Kevin Systrom, Instagram’s photo-sharing platform quickly became popular among its users. Throughout the rise of the latest social network, Systrom kept in touch with Mark Zuckerberg, as the two had previously become acquainted through events at Stanford. Facebook ultimately made the move to acquire Instagram in 2012 for a total of $1 billion in cash and stock.
21. WhatsApp was Acquired for $21 Billion in 2014
A much bigger acquisition for Zuckerberg and Facebook was that of WhatsApp in 2014. Initially, Facebook made a bid of $16 billion to acquire the messaging app. However, Facebook paid a total of $21.8 billion to take ownership of WhatsApp. So, why the price increase? It was agreed that Facebook would pay $19.6 billion, but an additional $3.6 billion was tacked on as compensation for WhatsApp employees who would be staying on board as part of Facebook.
Use These Meta Statistics to Fuel Your Online Presence
Now that you’re armed with all of these impressive Meta statistics, use this data to shape your social media presence moving forward. This information will help you determine which platforms to invest time and money into so you can generate more brand awareness.
Interested in learning how The Social Shepherd can help you strengthen your social media strategy? Get in touch today for more details.


