21 Essential eCommerce Statistics You Need to Know in 2026

Contents
- Top eCommerce Statistics
- Global eCommerce Statistics
- UK eCommerce Statistics
- eCommerce Growth Statistics
- eCommerce Platform Statistics
- Social Commerce Statistics
- Mobile Commerce Statistics
- eCommerce for Business Statistics
- Using These eCommerce Statistics
- Enjoyed reading these statistics? Find more statistics you need to know in 2026.
In this day and age, online shopping has become the way to go. eCommerce has made it so much simpler to purchase everything from clothing to beauty products, home goods, and even groceries.
With a few clicks, you can easily place and order, and wait for it to arrive on your doorstep. You never have to leave the comfort of your home!
To help you learn more about online shopping, we’ve compiled some interesting eCommerce statistics you should know for 2026.
With the help of this data, you can strengthen your own eCommerce business and generate more sales than before.
Stay up to date
Top eCommerce Statistics
To get started, here are a few eCommerce statistics to keep in mind:
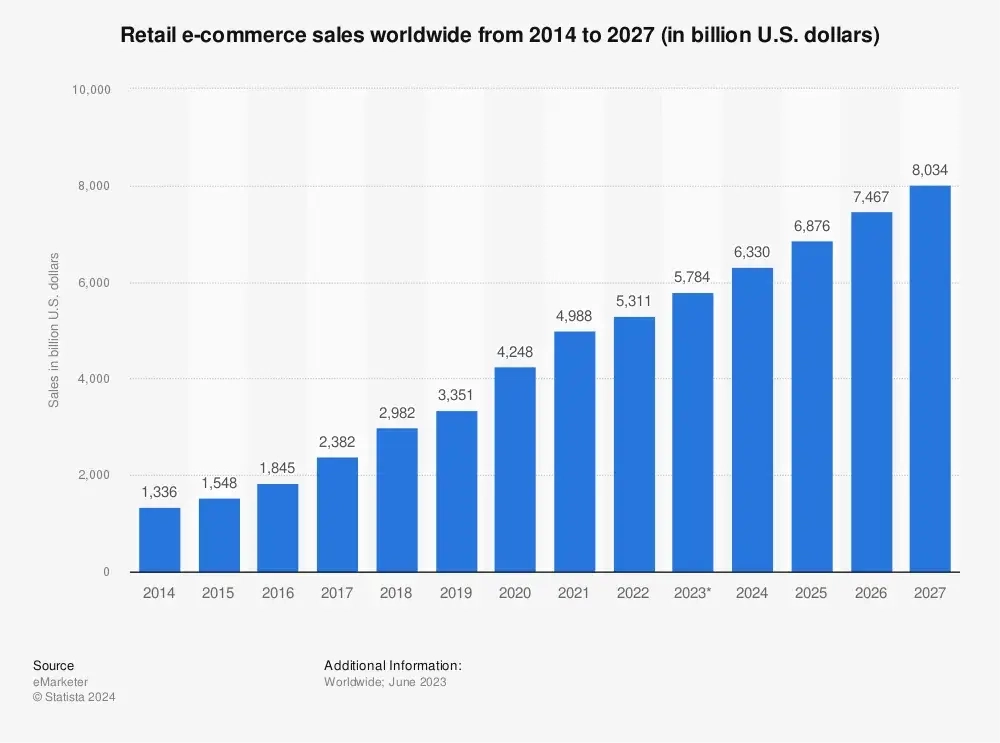
eCommerce Sales Are Projected to Reach $8 Trillion by 2027
In 2023, retail eCommerce sales were an estimated $5.7 trillion U.S. dollars worldwide.
Over the next four years, it’s predicted this number will grow by 39%, reaching just over $8 trillion by 2027. There are no signs of online shopping slowing down anytime soon.
Women Make About 7 Online Purchases Per Year
In the world of online shopping, ladies take the lead, making purchases more often, around seven times a year, while men clock in at about five times. Interestingly, when men do shop online, they tend to splash out more, averaging $220 per transaction, compared to women's $151.
Adding a twist to the pace, women are speedy decision-makers, closing the deal 7% faster than their male counterparts. No wonder many online retailers aim their social media campaigns at women, tapping into that quick decision-making vibe and sparking a bit of impulse buying!
There Are Between 12 and 24 Million Online Stores
While it’s hard to determine an exact number, it’s estimated that there are anywhere between 12 and 24 million online stores. And with more people starting online businesses, that number is only going to steadily increase over the next few years.
Amazon Saw Almost 3.16 Billion Monthly Visitors in 2022, Making it a Top Online Retailer Worldwide
When compared to online retailers, it appears Amazon is coming out on top. In 2022, the retailer saw almost 3.16 billion monthly visitors on its website.
This number has decreased since 2020, during the COVID-19 pandemic, when it reached 3.67 billion monthly visitors due to more people choosing to shop online instead of hitting the stores. The second most popular online retailer was eBay, which saw a monthly average of 589 million visitors.

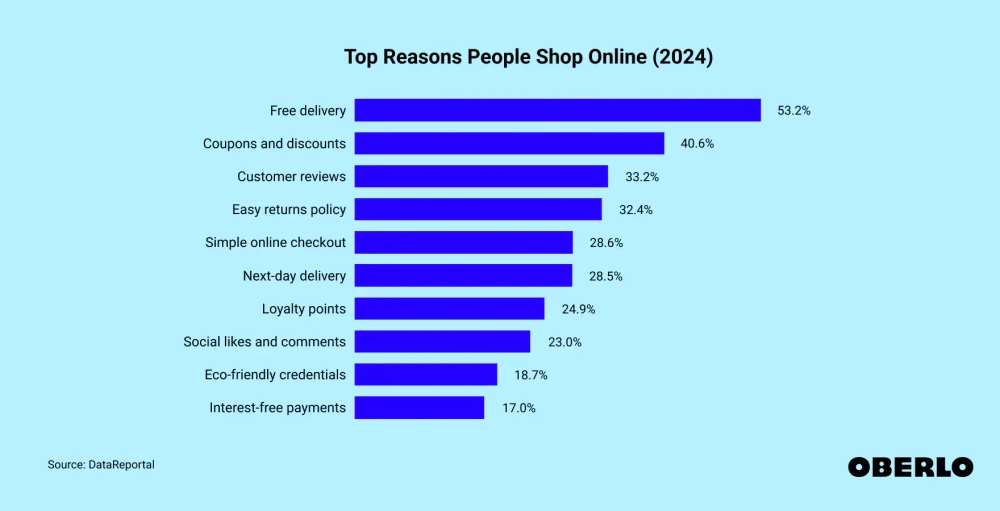
53.2% of People Say Free Shipping is the Top Reason They Shop Online
Have you ever passed on ordering something online because shipping wasn’t free or too expensive? You aren’t alone.
53.2% of people say free shipping is one of the main reasons they choose to shop online. This, in combination with Amazon’s vast product selection, is likely why they see great success. Here’s a full breakdown of why consumers say they shop online:
Global eCommerce Statistics
There are online shoppers based all over the globe. However, some countries and certain age groups are bigger shoppers than others. Check out this data:
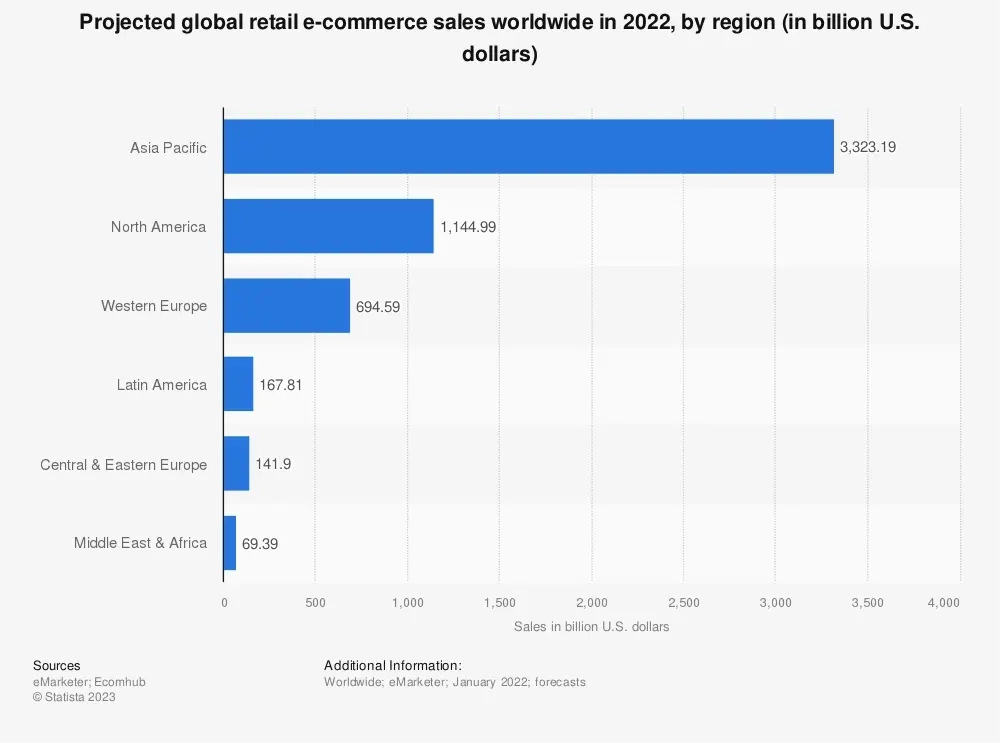
The Top Three eCommerce Markets Are Asia Pacific, North America, and Western Europe
In 2022, the Asia Pacific region held its ground as the global frontrunner in e-commerce sales, boasting a staggering value surpassing 3.3 trillion U.S. dollars. Following closely were North America and Western Europe, contributing an estimated 1.15 trillion and 695 billion dollars to the e-commerce landscape during that year.
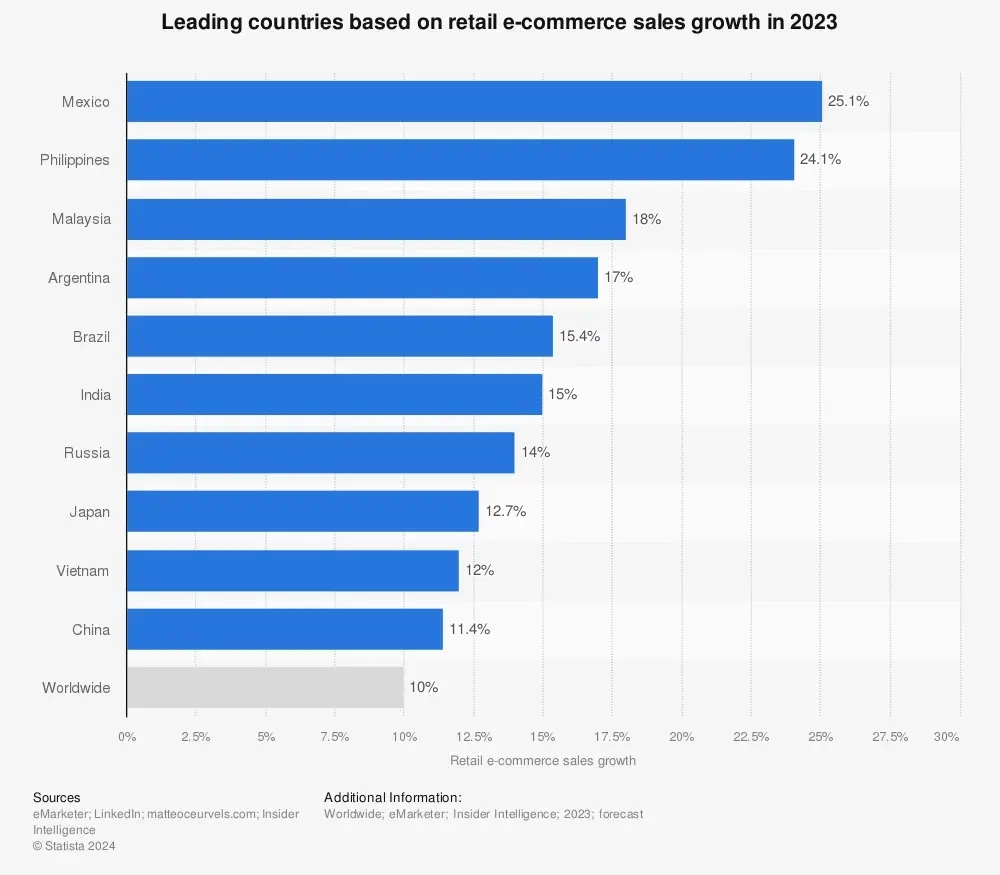
With 25.1% Growth, Mexico Is Seeing the Fastest eCommerce Growth in 2023
Topping the list are Mexico and the Philippines, poised for a surge of approximately 25 percent and 24 percent in online sales, respectively.
Most eCommerce Enthusiasts in the U.S. Are 18-24 Years Old
As of March 2023, the predominant chunk of e-commerce enthusiasts in the United States fell within the age bracket of 18 to 24, capturing a sizable 46.9%, as deduced from geolocated mobile user data. Meanwhile, the cohort of adults aged 25 to 34 secured a substantial slice, comprising nearly 32% of the mobile audience engaged in e-commerce activities across the country.
UK eCommerce Statistics
Even those in the UK are passionate about their online shopping. Here are some eCommerce statistics that are specifically related to the United Kingdom:
It’s Expected the UK’s eCommerce Revenue Will Grow 5.16% Annually
According to eCommerce statistics from Statista, online shopping revenue won’t be slowing down in the UK. From 2021 to 2025, it’s predicted the overall eCommerce revenue in the UK will grow at an annual rate of 5.16%.
Mobile Devices Were Used to Make 70% of Online Shopping Purchases in the UK During the Thirs Quarter of 2024
In the UK, it’s all about mobile shopping.
Looking at data from the third quarter of 2024, 76% of retail site visits in the UK came from a smartphone.
72% of online shopping orders were made via mobile devices.
On the other hand, only 21% of retail website traffic was from desktop computers and accounted for 26% of all purchases.
eCommerce Growth Statistics
Just how much has eCommerce grown in recent years? Well, the COVID-19 pandemic has generated a rise in online shopping since 2020, and it shows no signs of slowing down.
Global Retail eCommerce Sales Grew by 25.7% in 2020
Global data shows retail eCommerce sales declined to 6.5% in 2022 after reaching 25.7% during the pandemic in 2020. Those sales accounted for about 19% of all global retail sales. It’s likely those numbers will continue to grow year after year. And, so far in 2023, eCommerce sales have grown by 8.9%.
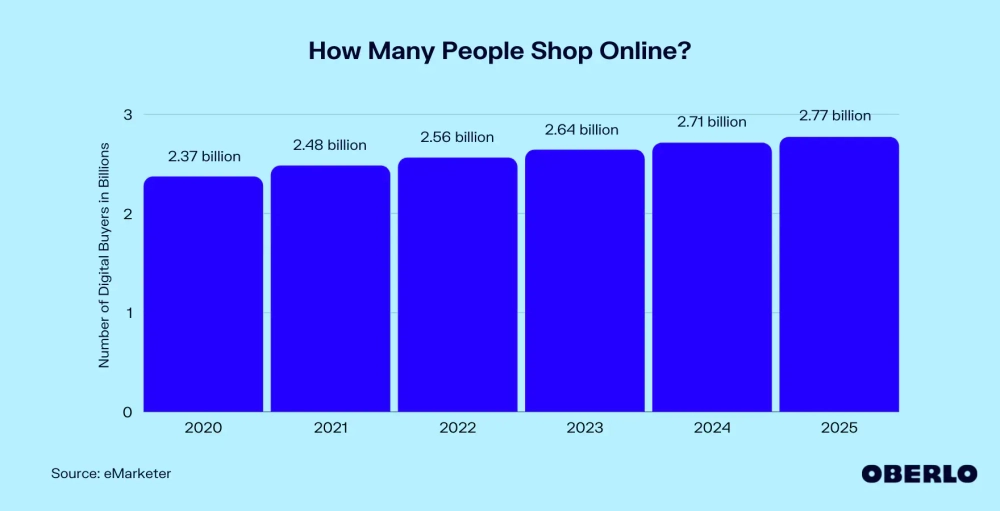
2.71 Billion People Are Expected to Shop Online in 2024, Up From 2.37 Billion People in 2020
It was estimated that 2.71 billion people worldwide are expected to shop online in 2024 to purchase goods and services. That’s a big jump from just 1.66 billion people online shopping in 2016.
eCommerce Platform Statistics
If you’re interested in creating your own eCommerce business, you may be wondering which platform is the most popular. While they each have their own benefits, here’s some data on how many users are on WooCommerce, Shopify, Magento, and Wix:
WooCommerce and Shopify Are The Most Popular eCommerce Platforms
Over 3.5 million live websites currently use WooCommerce, a WordPress plugin to power their online storefronts.
There are 5.6 million merchants on Shopify.
Both platforms have their benefits, which is why it’s important for sellers to do their research to find out which is best for them.
There are over 250,000 merchants using Magento and over 600,000 active stores on Wix.
Social Commerce Statistics
Did you know social media can help boost your eCommerce business? It’s true! Take a look at this data:
Online Stores With a Social Media Presence See an Average of 32% More Sales
More sales are always a win, right? eCommerce statistics show that online stores that also have a social media presence have, on average, 32% more sales than those not using social media. This could be because social media increases a shop’s discoverability online.
Customers Referred to an Online Store Via Instagram Have an Average Order of $65
For some, Instagram could be key to generating sales. $65 is the average order value for customers who have been referred to an online shop via Instagram. This is a higher total than platforms seem to generate.
The average for Facebook is $55, $46 for Twitter, and $38 for YouTube.
Mobile Commerce Statistics
eCommerce statistics show that mobile shopping is a popular choice when buying products and services online. Here’s some data regarding how often we use our phones and tablets to shop:
Mobile eCommerce Accounts for 44.2% of All eCommerce Sales in the U.S.
eCommerce statistics show that mobile purchases account for 44.2% of all eCommerce sales in the United States. Only time will tell if mobile purchases are able to one day be the majority of eCommerce sales.
Three Out of Four Consumers Shop From Their Smartphones
With mobile-friendly websites and dedicated applications, shopping from your smartphone is pretty easy these days. That’s why it’s not surprising three out of four consumers say they shop from their phone.
65% of Shoppers Look Up Price Comparisons on Mobile While in a Physical Store
It’s important to be an educated shopper, which is why we love to price shop to ensure we’re getting the best deal. As a result, 65% of shoppers say they look up price comparisons on their mobile devices while shopping in a physical store. It’s a convenient way to see what other retailers are selling something for.
52% of Customers Say a Poor Mobile Website Experience Breaks Their Trust
For over half of individuals, a subpar mobile experience is a trust-breaker, with 52% expressing that it erodes their confidence in a company. The significance of a website's design is undeniable, as a staggering 94% of first impressions are intricately tied to it. Moreover, the demand for a stellar mobile experience remains high, with 85% of users expecting it to match the quality of a desktop encounter. When the mobile experience falls short, frustration sets in for nearly half—48%—of users.
eCommerce for Business Statistics
For those running an eCommerce business (or wanting to start one), there are a couple of statistics you’ll want to keep in mind to ensure your success.
Here’s what you should know:
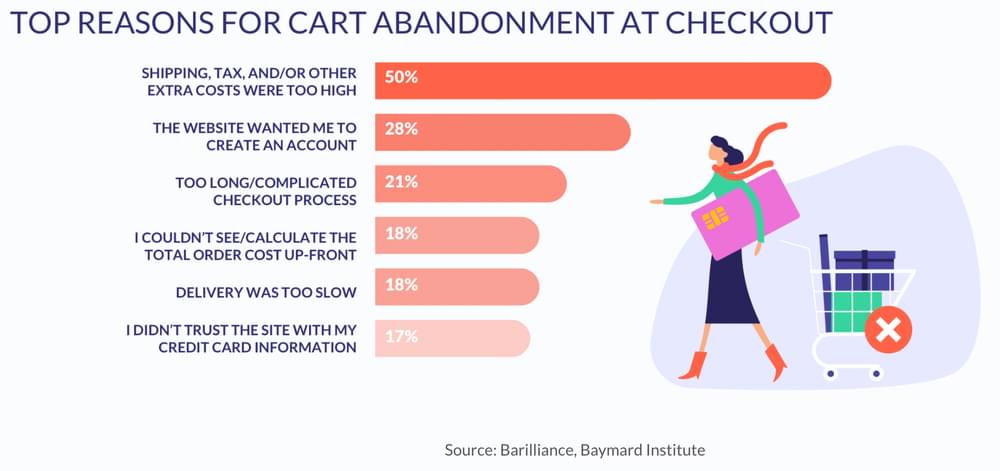
The Top Reason for Abandoned Carts is Expensive Fees
When your business has a goal to generate more sales, you’ll want to cut down on the number of abandoned carts you have.
Data shows the top reason people abandon carts is because of additional fees costing too much. Those fees can be things like shipping, tax, and any other costs that may be factored into the final total during checkout.
Other reasons for abandoned carts include: being required to make an account, long or complicated checkout processes, and not knowing the cost upfront.
eCommerce Can be More Effective With the Help of Bots and Automation
Done right, having a chatbot or some other artificial intelligence on your website could help with the overall eCommerce process.
It can assist in answering basic questions, ultimately helping to eliminate barriers for potential customers wanting to purchase. In fact, 50% of people say they’d purchase from a website’s chatbot with the help of conversational marketing.
It could be worth looking into for your business to increase your conversion rate.
Using These eCommerce Statistics
There’s no time like the present to start your own eCommerce business.
Although there are tons of online shops, it’s never too saturated of an industry to get started and put your own spin on things. Use these eCommerce statistics to show you how powerful online sales can be and to create an online strategy of your own.
Enjoyed reading these statistics? Find more statistics you need to know in 2026.
You might also like


Don’t be sheepish
let’s talk